
On 15 October 2026, Akeneo and Inriver both announced that Gartner named them Leaders in the 2026 Magic Quadrant for Product Information Management Solutions. Akeneo’s announcement lists supplier data onboarding as part of its platform, and Inriver’s mentions importing unstructured sources such as PDFs and brochures into its data model. They are right about the direction. Pulling attributes out of a supplier PDF is turning into a platform feature, and I expect it to be a line item on most vendors’ roadmaps within a year.
But I think they are being too polite about where the work actually sits. Extraction is the part that gets faster. The part that does not get faster is deciding what your product model is willing to receive. In a pilot we ran this autumn, that decision, not the extraction, determined how much of the supplier data ended up usable.
What the pilot measured
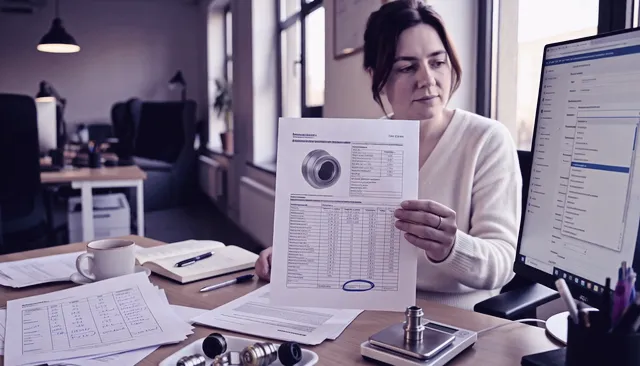
The customer is an industrial distributor running Pimcore. They gave us 12 files from six suppliers: catalogs, brochures, marketing and technical data sheets, and one multi-sheet spreadsheet in seven languages. We loaded their existing product model into openProd and let it extract attributes and match them against that model.
| Measure | Result in the pilot |
|---|---|
| Files / suppliers | 12 / 6 |
| Products extracted | 175 to 246, depending on whether variants are counted separately |
| Attribute values extracted | more than 9,000 |
| Machine processing time | about 67 minutes |
| Human review time | up to about 2 hours, by the people who built the tool |
| Human decisions | about 550, most of them taken in bulk |
| Share of extracted attributes matching the existing model | 37% on average |
The existing model was not small. It held close to four thousand attributes in a classification store. It still matched 37% of what the supplier files carried. The remaining 63% was proposed by the system as new attributes.
Two caveats before going further. First, this is one pilot with one customer, six suppliers and a few hundred products. The 37% is a measurement from that pilot, not a market benchmark. Second, the two-hour review figure comes from the team that built the tool, so it is a lower bound for a customer team, and it excludes the subject-matter sign-off that product managers still have to give.
Coverage was never one number
Averages hide the shape of the problem. Coverage varied a lot by supplier.
| Supplier (anonymized) | Share of extracted attributes matching the model |
|---|---|
| Supplier A | 82% |
| Supplier B | 72% |
| Supplier C | 41% |
| Supplier D | 31% |
These are four of the six suppliers; the average across all twelve files is the 37% quoted above. A fifth supplier started at 61% and reached 90 to 95% as further data sheets from the same supplier were imported, which is consistent with decisions carrying over from one import to the next.
We did not investigate every gap, so what follows is interpretation. A product model describes what a company has historically sold and documented. A supplier whose products sit close to that history will show high coverage. A supplier whose product line sits outside it will show low coverage, however good the extraction is. Better extraction cannot raise a number that is limited by the model.
Every unmatched value forces a choice
When the system extracts a value that has no home in the model, someone has to pick one of three options:
- Adopt it. Create a new attribute. It now has to be maintained, translated, validated and exposed in every export and feed that uses the product record.
- Map it. The model already has this attribute under another name, unit or format, and the value belongs there.
- Drop it. The value is accurate but not worth the cost of carrying it.
None of these is an extraction question. All three are decisions about the model, and each has a price that lasts longer than the import. Keeping the model as it is can be a legitimate position. The point is that it is a position, that somebody has to take it on purpose, and that no extraction technology can take it for them.
The consequence is easy to state. If nobody owns these decisions, the 63% gets rejected by default and the project delivers 37% of the value it could have. The tool is not at fault in that scenario, and neither is the PDF.
Where the cost moves
For years, the cost of supplier onboarding was counted in keystrokes per SKU. The pilot suggests the cost curve is changing shape.
| Step | What we measured | What it scales with |
|---|---|---|
| Extraction | about 67 minutes of machine time for 12 files | number of files |
| Review | up to about 2 hours, about 550 decisions | number of distinct decisions, not rows |
| Sign-off | not measured | whether a named owner exists |
Review effort tracked decisions, not rows. In one supplier’s file there were 200 decisions to take, and 184 of them were resolved in a single bulk action. A decision made once for an attribute applies to every product that carries it. That is a very different unit cost from re-keying values, and it is the reason the third row of the table matters more than the first. Extraction time is cheap and shrinking. Sign-off time is bounded by organizational structure, which software does not change.
For a CFO, the practical reading is this: the budget line for onboarding data should be split into what scales with volume (extraction, which is getting cheaper) and what scales with governance (model decisions, which are not). The second part is where projects stall.
What to do before your next onboarding project
- Measure coverage on two or three real supplier files before you choose a tool. Take files from your hardest suppliers, not your easiest. A coverage figure from your own data tells you more than any demo.
- Define three coverage tiers up front. What the existing model already accepts; what the model gains if you approve the attribute families you select; and the full set of what the files carry. Decide which tier the project is funded to reach.
- Name an owner for model decisions per product category. Not a committee. One person who can say adopt, map or drop, and who is accountable for the maintenance cost of what they adopt.
- Track coverage over time. In our pilot, coverage for one supplier climbed from 61% to the 90s as decisions accumulated. If your number is flat after several imports, the model is not learning from your decisions, or nobody is making them.
- Keep the review loop where your product managers already work. If they review in a spreadsheet, build the loop around the spreadsheet, not around a login they will not use.
Who decides what the model holds?
This pilot does not show that extraction is solved. It shows that when extraction works, the next limit is the model and the people who govern it. For an agent or a feed, a product that exists in your catalog with 37% of its available attributes looks like a product that knows less than the supplier does.
So the question for your next onboarding project is not whether your tool can read a PDF. It is who in your organization decides what your model will hold, and by when. Are you automating work, or automating rework?
If you want to see your own coverage number, we run pilots on a customer’s own supplier files: test a product data onboarding tool on your own files, or book a demo.
Related reading from the openProd Academy: